A graph visualization tool
Project description
Treevizer
Visualize node data structures using Graphviz.
How it works
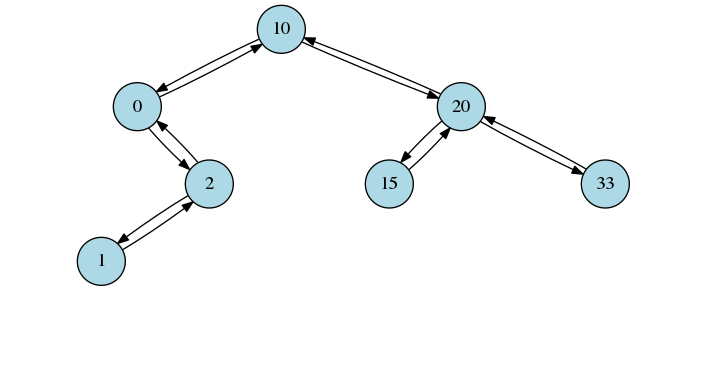
Treevizer iterates over your datastructure to generate a DOT file and runs Graphviz turn it into an image. The datastructure needs to be built using Nodes.
Examples
Linked list

Balanced binary tree

Prerequisites
You need to install Graphviz and make sure it is in $PATH.
Cygwin
Don't install Graphviz in Cygwin, do a windows installation. Otherwise there will be a problem with paths.
Installing
pip install treevizer
Usage
The following structures are supported:
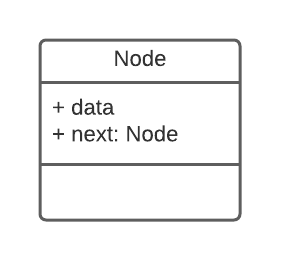
Linked list (ll)
Require a Node class with the attributes that fulfill the following class diagram.

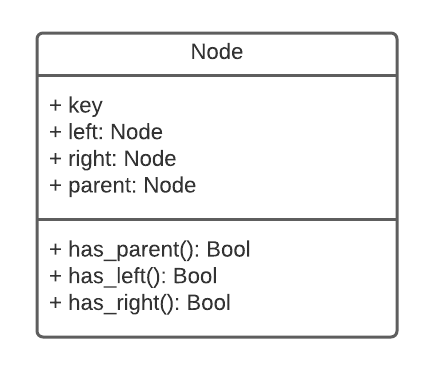
Balanced binary tree (bbt)
Require a Node class with the attributes that fulfill the following class diagram.

Functions
Structure to DOT file
import Treevizer

treevizer.to_dot(root, structure_type="bbt", dot_path="tree.dot"):
    """
    Generate DOT file from node structure.

    Parameters
    ----------
    root : Node
        Root node for datastructure
    structure_type : str
        Name of the type of datastructure (default is "bbt")
    dot_path : str
        Path to generated DOT file (default is tree.dot)
    """
Structure to PNG
This also creates a DOT file.
import Treevizer

treevizer.to_png(root, structure_type="bbt", dot_path="tree.dot", png_path="tree.png"):
    """
    Generate DOT file from node structure and use Graphviz to create image.

    Parameters
    ----------
    root : Node
        Root node for datastructure
    structure_type : str
        Name of the type of datastructure (default is "bbt")
    dot_path : str
        Path to generated DOT file (default is tree.dot)
    png_path : str
        Path to generated png file (default is tree.png)
    """
DOT file to PNG
import Treevizer

treevizer.dot_to_png(dot_path="tree.dot", png_path="tree.png"):
    """
    Use Graphviz to create image from a DOT file.

    Parameters
    ----------
    dot_path : str
        Path to your DOT file (default is tree.dot)
    png_path : str
        Path to generated png file (default is tree.png)
    """
Configure
Create .dot.json in root folder to change DOT configuration. Available options can be found in Graphviz documentation.
For example to change color of Nodes in image for balanced binary tree use the following.
# .dot.json
{
    "BalancedBinaryTree": {
        "node": {
            "fillcolor": "green"
        }
    }
}
To change size and shape of nodes and color of edges in Linked list use the following.
# .dot.json
{
    "LinkedList": {
        "node": {
            "shape": "square",
            "width": 1.5
        },
        "edge": {
            "color": "red"
        }
    }
}
Known Errors/Warnings
Links
License
This project is licensed under the MIT License - see the LICENSE.md file for details
Project details
Release history Release notifications | RSS feed
Download files
Download the file for your platform. If you're not sure which to choose, learn more about installing packages.
Source Distributions
Built Distribution
Hashes for treevizer-0.0.9-py3-none-any.whl
| Algorithm | Hash digest | |
|---|---|---|
| SHA256 | 21753a66c670a81bd06232b270095a0d6ae4a99679285ce304b0d743b39eaf10 |
|
| MD5 | 2f34e15638f237536683240295bec13c |
|
| BLAKE2b-256 | eecdca956a35829d299c0eb1c14c232cbe3b623c7574d3e114dd1795de093d88 |


