APSG - structural geology module for Python
Project description

APSG defines several new python classes to easily manage, analyze and visualize orientational structural geology data.
Free software: BSD license
Documentation: https://apsg.readthedocs.org.
APSG defines several new python classes to easily manage, analyze and visualize orientational structural geology data. Base class Vec3 is derived from numpy.array class and affers several new method which will be explained on following examples.
Basic usage
APSG module could be imported either into own namespace or into active one for easier interactive work:
from apsg import *
Basic operations with vectors
Instance of vector object Vec3 could be created from any iterable object as list, tuple or array:
>>> u = Vec3([1, -2, 3])
>>> v = Vec3([-2, 1, 1])
For common vector operation we can use standard mathematical operators or special methods using dot notation:
>>> u+v
V(-1.000, -1.000, 4.000)
>>> u-v
V(3.000, -3.000, 2.000)
>>> 3*u-2*v
V(7.000, -8.000, 7.000)
Its magnitude or length is most commonly defined as its Euclidean norm and could be calculated using abs:
>>> abs(v)
2.4494897427831779
>>> abs(u+v)
4.2426406871192848
For dot product we can use multiplification operator * or dot method:
>>> u*v
-1
>>> u.dot(v)
-1
For cross product we can use operator ** or method cross:
>>> u**v
V(-5.000, -7.000, -3.000)
>>> u.cross(v)
V(-5.000, -7.000, -3.000)
To project vector u onto vector v we can use method proj:
>>> u.proj(v)
V(0.333, -0.167, -0.167)
To find angle (in degrees) between to vectors we use method angle:
>>> u.angle(v)
96.263952719927218
Method rotate provide possibility to rotate vector around another vector. For example, to rotate vector u around vector v for 45°:
>>> u.rotate(v,45)
V(2.248, 0.558, 2.939)
Classes Lin and Fol
To work with orientational data in structural geology, APSG provide two classes derived from Vec3 class. There is Fol class to represent planar features by planes and Lin class to represent linear feature by lines. Both classes provide all Vec3 methods, but they differ in way how instance is created and how some operations are calculated, as structural geology data are commonly axial in nature.
To create instance of Lin or Fol class, we have to provide dip direction and dip, both in degrees:
>>> Lin(120,60)
L:120/60
>>> Fol(216,62)
S:216/62
or we can create instance from Vec3 object using aslin and asfol properties:
>>> u.aslin
L:297/53
>>> u.asfol
S:117/37
Vec3 methods for Lin and Fol
To find angle between two linear or planar features:
>>> l1 = Lin(110,40)
>>> l2 = Lin(160,30)
>>> l1.angle(l2)
41.597412680035468
>>> p1 = Fol(330,50)
>>> p2 = Fol(250,40)
>>> p1.angle(p2)
54.696399321975328
To construct planar feature defined by two linear features:
>>> l1**l2
S:113/40
To construct linear feature defined as intersection of two planar features:
>>> p1**p2
L:278/36
Cross product of planar and linear features could be used to construct plane defined by linear feature and normal of planar feature:
>>> l2**p2
S:96/53
or to find perpendicular linear feature on given plane:
>>> p2**l2
L:276/37
To rotate structural features we can use method rotate:
>>> p2.rotate(l2,45)
Group class
Group class serve as a homogeneous container for Lin or Fol objects. It allows grouping of features either for visualization or batch analysis.
>>> d = Group([Lin(120,60), Lin(116,50), Lin(132,45), Lin(90,60), Lin(84,52)], name='L1')
>>> d
L1: 5 Lin
Method len returns number of features in group:
>>> len(d)
5
Property resultant gives mean or resultant of all features in group:
>>> d.resultant
L:110/55
To measure angles between all features in group and another feature, we can use method angle:
>>> d.angle(d.resultant)
array([  7.60329482,   6.24648167,  17.37186861,  11.6536752 ,  15.3996262 ])
To rotate all features in group around another feature, we can use method rotate:
>>> dr = d.rotate(Lin(150, 30), 45)
To show data in list you can convert it to python list:
>>> list(dr)
[L:107/35, L:113/26, L:126/30, L:93/26, L:94/18]
To calculate orientation tensor of all features in group, we can use method ortensor:
>>> d.ortensor
Ortensor:
(E1:4.77,E2:0.2011,E3:0.02874)
[[ 0.36990905 -0.48027385 -0.71621555]
 [-0.48027385  1.42230591  2.10464496]
 [-0.71621555  2.10464496  3.20778504]]
Ortensor class
Ortensor class represents orientation tensor of set of planar or linear features. Eigenvalues and eigenvectors could be obtained by methods eigenvals and eigenvects. Eigenvectors could be also represented by linear or planar features using properties eigenlins and eigenfols:
>>> ot = Ortensor(d)
>>> ot.eigenvals
(0.95403846865963882, 0.040212749461964618, 0.0057487818783964056)
>>> ot.eigenvects
Default: 3 Vec3
>>> list(ot.eigenlins)
[L:110/55, L:5/10, L:268/33]
>>> list(ot.eigenfols)
[S:290/35, S:185/80, S:88/57]
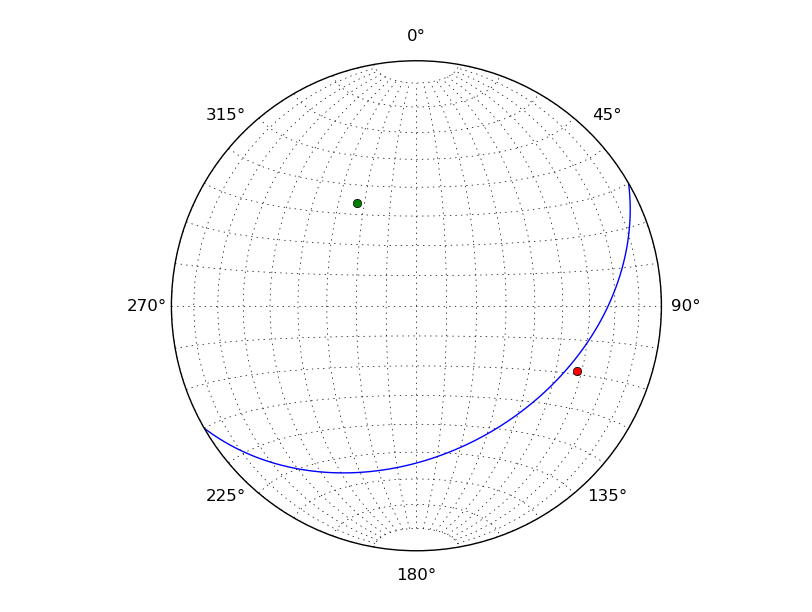
StereoNet class
Any Fol, Lin, Vec3 or Group object could be visualized in stereographic projection using mplstereonet (https://github.com/joferkington/mplstereonet), which must be accessible on current PYTHONPATH. Hi-level commands are adopted for APSG objects, while all original mplstereonet methods and properties are accessible trough ‘ax’ property:
>>> s = StereoNet()
>>> s.plane(Fol(150,40))
>>> s.pole(Fol(150,40))
>>> s.line(Lin(112,30))
>>> s.grid()
>>> plt.show()

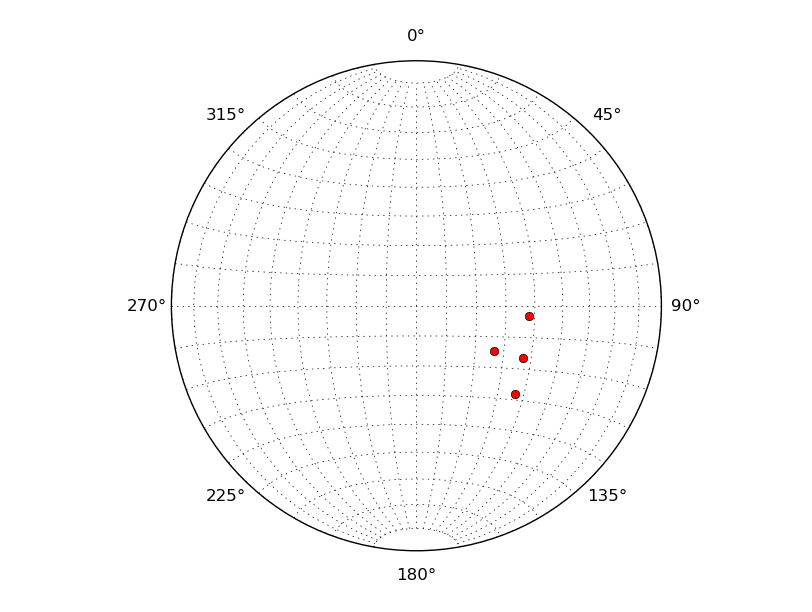
A Group object could be plotted as well:
>>> s = StereoNet()
>>> g = Group([Lin(120,60), Lin(116,50), Lin(132,45), Lin(95,52)], name='Test')
>>> s.line(g, 'ro')
>>> s.grid()
>>> plt.show()

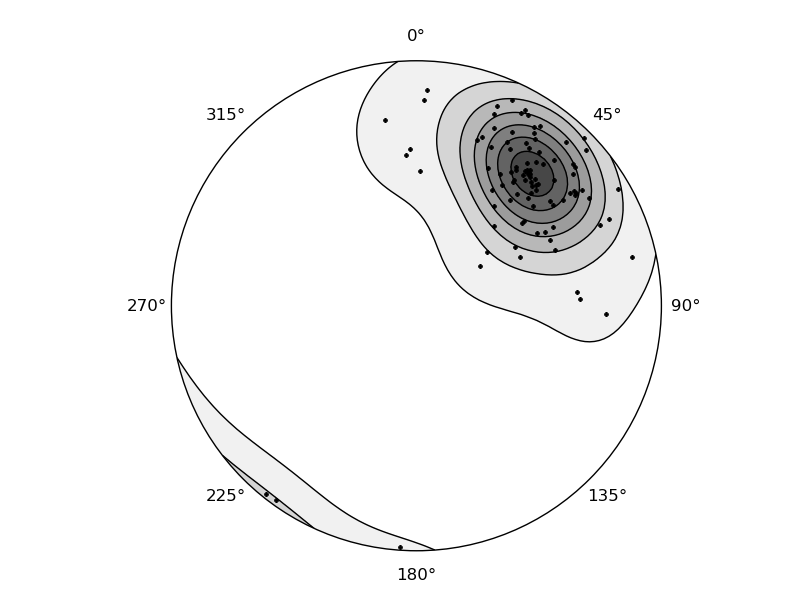
To make density contours plots, a density_contour and density_contourf methods are available:
>>> s = StereoNet()
>>> g = Group.randn_lin(mean=Lin(40,30))
>>> s.density_contourf(g, levels=range(1,50,5), cmap='gray_r')
>>> s.density_contour(g, levels=range(1,50,5), colors='k')
>>> s.line(g, 'k.')
>>> plt.show()

Some tricks
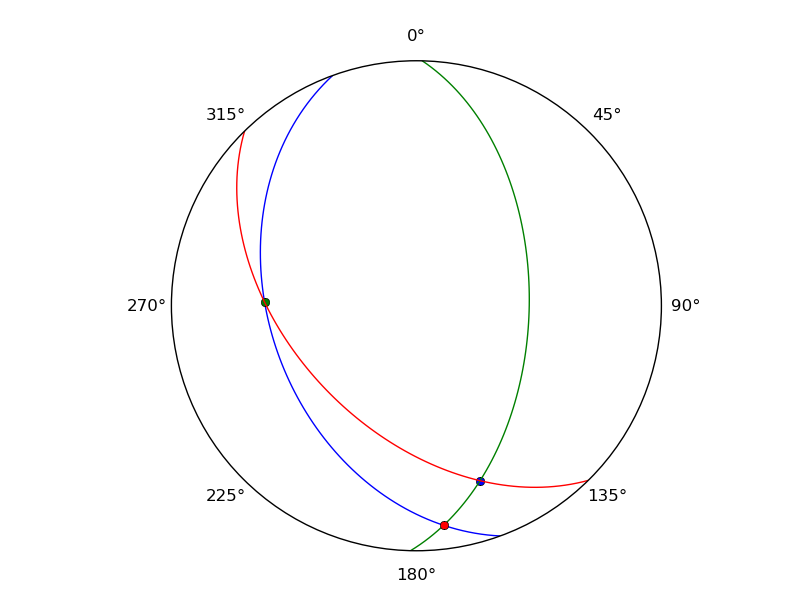
Double cross product is allowed:
>>> s = StereoNet()
>>> p = Fol(250,40)
>>> l = Lin(160,25)
>>> s.plane(p, 'b')
>>> s.line(l, 'bo')
>>> s.plane(l**p, 'g')
>>> s.line(p**l, 'go')
>>> s.plane(l**p**l, 'r')
>>> s.line(p**l**p, 'ro')
>>> plt.show()

Correct measurements of planar linear pairs:
>>> from apsg.core import fixpair
>>> p1, l1 = fixpair(p,l)
>>> s = StereoNet()
>>> s.plane(p, 'b')
>>> s.line(l, 'bo')
>>> s.plane(p1, 'g')
>>> s.line(l1, 'go')
>>> plt.show()

History
0.1.0 (2014-01-11)
First release of APSG
Project details
Release history Release notifications | RSS feed
Download files
Download the file for your platform. If you're not sure which to choose, learn more about installing packages.


