plotext plots data directly on terminal

Project description
The package plotext allows to plot data directly on terminal.
Basic Example
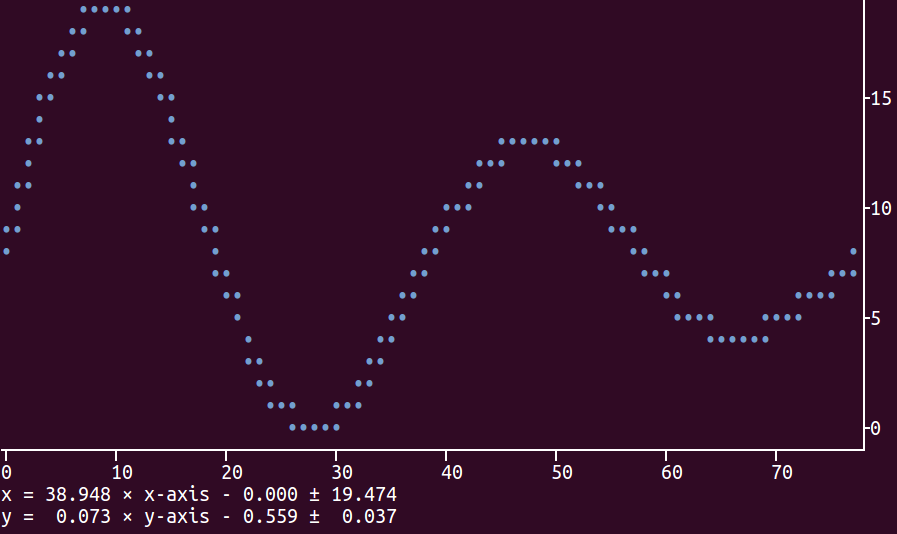
Here is a basic example of plotting data on terminal using the plotext package
Installation
To install the latest version of the plotext package use the following command:
sudo -H pip install plotext
How to Use
To import the package in python 3 use the command:
import plotext.plot as plx
To plot a scatter plot of data you could use a command like this:
plx.scatter(x, y)
where x and y are the lists of data for respectively the x and y coordinates; optionally, a single y list could be provided.
To plot data points connected by straight lines use instead:
plx.plot(x, y)
In order to show the final result just add:
plx.show()
In the following we provide examples on how to use the scatter function with additional options; the same options could be used for the plot function.
Plot Dimensions
If no dimension settings are provided, the plot will automatically cover the entire terminal canvas. To manually set the plot canvas dimension, use a command like this:
plx.scatter(x, y, cols=90, rows=30)
which would set the width of the plot to 90 characters and the height to 30 characters. If only one of the two dimensions are provided, the other will automatically be set to the highest value allowed by the the terminal size. If one of the dimensions provided is bigger then the maximum allowed by the canvas size, it will automatically be reset to its highest value allowed by the the terminal size.
An alternative way to set the canvas dimension is to use the following equivalent commands:
plx.scatter(x, y)
plx.set_cols(90)
plx.set_rows(30)
You can access the value set for cols and rows respectively with the following commands:
plx.get_cols()
plx.get_rows()
You can access the terminal size with the command:
plx.get_terminal_size()
which returns the width and height of the terminal canvas.
Point Style
In order to chose whatever or not to show each data point use a command like this:
plx.scatter(x, y, point=True)
where the default value is True for the scatter function and False for the plot function. Alternatively after the scatter function with:
plx.set_point(True)
You can access the value set for the option point with the following command:
plx.get_point()
In order to change the marker used for each data point use a command like this:
plx.scatter(x, y, point_marker='*')
where only single characters are allowed; the default value is •. Alternatively after the scatter function with:
plx.set_point_marker('*')
You can access the value set for the option point_marker with the following command:
plx.get_point_marker()
In order to change the color of the point marker use a command like this:
plx.scatter(x, y, point_color='red')
or, alternatively after the scatter function with:
plx.set_point_color('red')
To access the available color codes use the commands:
plx.get_colors()
You can access the value set for the option point_color with the following command:
plx.get_point_color()
Line Style
In order to chose whatever or not to plot lines between the data points use a command like this:
plx.scatter(x, y, line=True)
the default value is False for the scatter function and True for the plot function. Alternatively after the scatter function with:
plx.set_line(True)
You can access the value set for the option line with the following command:
plx.get_line()
In order to change the marker used to draw the lines use a command like this:
plx.scatter(x, y, line_marker='*')
where only single characters are allowed; the default value is •. Alternatively after the scatter function with:
plx.set_line_marker('*')
You can access the value set for the option line_marker with the following command:
plx.get_line_marker()
In order to change the color of the marker used for the lines use a command like this:
plx.scatter(x, y, line_color='red')
or, alternatively after the scatter function with:
plx.set_line_color('red')
To access the available color codes use the commands:
plx.get_colors()
You can access the value set for the option line_color with the following command:
plx.get_line_color()
Plot Axes
You could chose whatever or not to show the x and y axes with a command like this:
plx.scatter(x, y, axes=[True, False])
which would show the x axis while hiding the y axis.
Alternatively you could use one of the following formats:
plx.scatter(x, y, axes=True)
plx.scatter(x, y, axes=False)
which would add, in the first case, and remove, in the second, both axes.
Alternatively the same options could be provided outside the scatter function, in this way:
plx.scatter(x, y)
plx.set_axes([True, False])
You can access the value set for the option axes with the following command:
plx.get_axes()
In order to change the axes color (including axes ticks and equations, when present) use a command like this:
plx.scatter(x, y, axes_color='blue')
plx.scatter(x, y, axes_color='igreen')
which would set the color of the axes to blue, in the first case, and inverted green in the second.
To access the available color codes use the following command:
plx.get_colors()
You can access the value set for the option axes_color with the following command:
plx.get_axes_color()
Axes Ticks
You could chose whatever or not to show the x and y axes numerical ticks with commands like these:
plx.scatter(x, y, ticks=[True, False])
plx.scatter(x, y, ticks=True)
plx.scatter(x, y, ticks=False)
or, alternatively after the scatter function with a command like this:
plx.set_ticks([True, False])
You can access the value set for the option ticks with the following command:
plx.get_ticks()
In order to set the spacing between x and y ticks use a command like this:
plx.scatter(x, y, spacing=5)
plx.scatter(x, y, spacing=[5, 8])
where only positive integers are allowed; a list of two numbers would set the spacing of the x and y ticks independently. Alternatively after the scatter function with:
plx.set_spacing([True, False])
You can access the value set for the option spacing with the following command:
plx.get_spacing()
Equations
In order to chose whatever or not to show the equations at the end of the plot use a command like this:
plx.scatter(x, y, equations=True)
plx.scatter(x, y, equations=False)
or, alternatively after the scatter function with:
plx.set_equations(False)
You can access the value set for the option equations with the following command:
plx.get_equations()
In order to set the number of decimal points in the equations use a command like this:
plx.scatter(x, y, decimals=4)
where only positive integers are allowed.
You can access the value set for the option decimals with the following command:
plx.get_decimals()
In order to manually determine the real x coordinate from the plot column coordinates use a command like this:
plx.get_x_from_xaxis(50)
In order to manually determine the real y coordinate from the plot row coordinates use a command like this:
plx.get_y_from_yaxis(20)
Plot Limits
You could define the plot limits with a command like this:
plx.scatter(x, y, xlim=[0, 100], ylim=[-1, 1])
which would sets the limits on the x axis between 0 and 90 and the limits on the y axis between -1 and 1. Note that if one of the limits is None, that limit would be set automatically.
Alternatively the plot limits could be set outside the scatter function, in this way:
plx.scatter(x, y)
plx.set_xlim([0, 100])
plx.set_ylim([-1, 1])
You can access the plot limit values with the following commands:
plx.get_xlim()
plx.get_ylim()
Plot Data
In order to access the data being plotted you could use the following command:
plx.get_data()
which would return the x and y list provided in the scatter or plot function.
In order to access the length of the data list being plotted you could use the following command:
plx.get_length()
Show Options
In order to clean the terminal before plotting the data (useful, for example, when continuously plotting data) use a command like this after the scatter or plot function:
plx.show(clear=True)
You can access the value set for the option clear with the following command:
plx.get_clear()
When continuously plotting data it may be useful to add a sleeping time between plots in order to minimize undesired screen flashing. Use a command like this:
plx.show(sleep=0.01)
plx.show(sleep=False)
where the unit is seconds.
You can access the value set for the option sleep with the following command:
plx.get_sleep()
Package Version
In order to check the installed version of the package use a command like this:
plx.get_version()
Further Documentation
The full documentation of any of the functions shown above could be accessed using commands like these:
print(plx.scatter.__doc__)
print(plx.plot.__doc__)
print(plx.clear.__doc__)
Credits
- Author: Savino Piccolomo
- e-mail: piccolomo@gmail.com
Release history Release notifications | RSS feed


Download files
Download the file for your platform. If you're not sure which to choose, learn more about installing packages.
Source Distribution
Built Distribution
Filter files by name, interpreter, ABI, and platform.
If you're not sure about the file name format, learn more about wheel file names.
Copy a direct link to the current filters
File details
Details for the file plotext-0.1.16.tar.gz.
File metadata
- Download URL: plotext-0.1.16.tar.gz
- Upload date:
- Size: 13.4 kB
- Tags: Source
- Uploaded using Trusted Publishing? No
- Uploaded via: twine/1.15.0 pkginfo/1.5.0.1 requests/2.23.0 setuptools/41.4.0 requests-toolbelt/0.9.1 tqdm/4.35.0 CPython/3.5.2
File hashes
| Algorithm | Hash digest | |
|---|---|---|
| SHA256 |
7f0825ad26c4380373211a735e10fcdf92ad209ffe050948fcfe868c7e39244f
|
|
| MD5 |
a49cbf46535c932f299291084c3269aa
|
|
| BLAKE2b-256 |
b20800caa9976afc8ccf550b03dc243a5fb2ed4482b90bb9d1b2ff50f2e5f229
|
File details
Details for the file plotext-0.1.16-py3-none-any.whl.
File metadata
- Download URL: plotext-0.1.16-py3-none-any.whl
- Upload date:
- Size: 16.6 kB
- Tags: Python 3
- Uploaded using Trusted Publishing? No
- Uploaded via: twine/1.15.0 pkginfo/1.5.0.1 requests/2.23.0 setuptools/41.4.0 requests-toolbelt/0.9.1 tqdm/4.35.0 CPython/3.5.2
File hashes
| Algorithm | Hash digest | |
|---|---|---|
| SHA256 |
f5840b3d93de608065b25d58a2d2b63d4ae395a53b4c4ad66ae09caa1f3296b4
|
|
| MD5 |
f4f58d58d7a8c2ca75327692d7a39f28
|
|
| BLAKE2b-256 |
463a2b0604fcca3e8b219d1ab904682e4dee65a2db89b8bf5e38e550e9c616ff
|


