Debug-friendly call stacks & tracebacks with variable values and semantic highlighting

Project description
Python stack formatter
Print nicer tracebacks & call stacks, with more source code and the current variable values. This helps a lot when your only available debugging tool is a printout or a log file.
Before

After

Installation
pip install stackprinter
Logging exceptions
Call set_excepthook() somewhere to replace the default python crash message:
import stackprinter
stackprinter.set_excepthook(style='color')
Call show or format inside an except block to explicitely see the current exception. show prints to stderr, format returns a string (for logging). You can also pass previously caught exception objects into these methods.
try:
    something()
except:
    stackprinter.show()  # grab the current exception and print a traceback to stderr

    # ...or only return a string, e.g. for logging.
    message = stackprinter.format()
    logging.log(message)
By default, these calls will generate plain text. Pass style='color' to get funky terminal colors (a type of semantic highlighting, instead of syntax highlighting). For more configs, see the docs of format().
Printing the call stack of another thread
Pass a thread object to show or format.
thread = threading.Thread(target=something)
thread.start()
while True:
    stackprinter.show(thread) # or format(thread)
    time.sleep(0.1)
Printing the call stack of the current thread
Call show or format outside of exception handling.
stackprinter.show() # or format()
There's also show_current_stack(), which does the same thing everywhere, even inside except blocks.
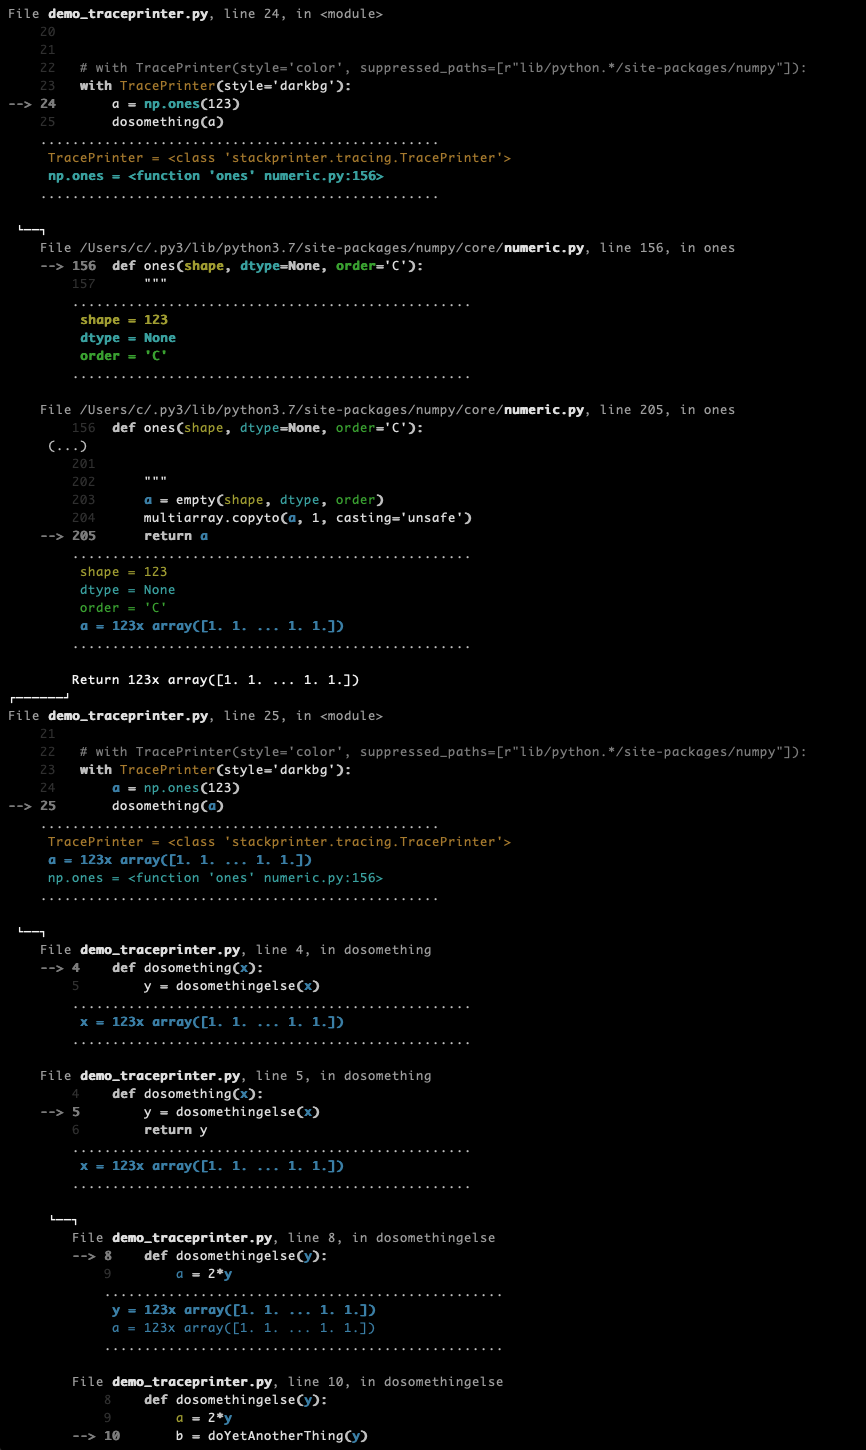
Tracing a piece of code as it is executed
More for curiosity than anything else, you can watch a piece of code execute step-by-step, printing a trace of all calls & returns 'live' as they are happening. Slows everything down though, of course.
tp = stackprinter.TracePrinter(style='color', suppressed_paths=[r"lib/python.*/site-packages/numpy"])
tp.enable()
a = np.ones(111)
dosomething(a)
tp.disable()
How it works
Basically, this is a frame formatter. For each frame on the call stack, it grabs the source code to find out which source lines reference which variables. Then it displays code and variables in the neighbourhood of the last executed line.
Since this already requires a map of where each variable occurs in the code, it was difficult to not also implement the whole semantic highlighting color thing seen in the screenshots. The colors are ANSI escape codes now, but it should be fairly straightforward™ to render the underlying data without any 1980ies terminal technology. Say, a foldable and clickable HTML page with downloadable pickled variables. For now you'll have to pipe the ANSI strings through ansi2html or something.
Caveats
This displays variable values as they are at the time of formatting. In multi-threaded programs, variables can change while we're busy walking the stack & printing them. So, if nothing seems to make sense, consider that your exception and the traceback messages are from slightly different times. Sadly, there is no responsible way to freeze all other threads as soon as we want to inspect some thread's call stack (...or is there?)
Docs
*coughs*
For now, just look at all the doc strings, e.g. those of format()
Release history Release notifications | RSS feed


Download files
Download the file for your platform. If you're not sure which to choose, learn more about installing packages.
Source Distribution
Built Distribution
Filter files by name, interpreter, ABI, and platform.
If you're not sure about the file name format, learn more about wheel file names.
Copy a direct link to the current filters
File details
Details for the file stackprinter-0.1.4.tar.gz.
File metadata
- Download URL: stackprinter-0.1.4.tar.gz
- Upload date:
- Size: 20.1 kB
- Tags: Source
- Uploaded using Trusted Publishing? No
- Uploaded via: twine/1.12.1 pkginfo/1.5.0.1 requests/2.21.0 setuptools/40.8.0 requests-toolbelt/0.9.1 tqdm/4.29.1 CPython/3.5.2
File hashes
| Algorithm | Hash digest | |
|---|---|---|
| SHA256 |
436a6880baa359f60d59f9f95dd71a803e679e53b3907cc13953fa24b8ef531d
|
|
| MD5 |
4c2089ab6893db4e564af332516b00d5
|
|
| BLAKE2b-256 |
68ffac85b236a73013d7490efa4d220bba0d3b83789f689da30add20380caf6c
|
File details
Details for the file stackprinter-0.1.4-py3-none-any.whl.
File metadata
- Download URL: stackprinter-0.1.4-py3-none-any.whl
- Upload date:
- Size: 23.2 kB
- Tags: Python 3
- Uploaded using Trusted Publishing? No
- Uploaded via: twine/1.12.1 pkginfo/1.5.0.1 requests/2.21.0 setuptools/40.8.0 requests-toolbelt/0.9.1 tqdm/4.29.1 CPython/3.5.2
File hashes
| Algorithm | Hash digest | |
|---|---|---|
| SHA256 |
9ee8bf2213b8df3d44935f164db00e57dee6a8f3b4a28e149ced76330ff56469
|
|
| MD5 |
9eb209e5214c672b2336d9d85c88fe3b
|
|
| BLAKE2b-256 |
5ba63517a73a6e58d27d4f877b22696456719d1958b68343a5815f364ff5a492
|


