a python command-line tool which draws basic graphs in the terminal

Project description
Termgraph
A python command-line tool which draws basic graphs in the terminal.
Graph types supported:
- Bar Graphs
- Color charts
- Multi-variable
- Stacked charts
- Horizontal or Vertical
- Emoji!
Examples
termgraph data/ex1.dat

# Reading data from data/ex1.dat

2007: ▇▇▇▇▇▇▇▇▇▇▇▇▇▇▇▇▇ 183.32
2008: ▇▇▇▇▇▇▇▇▇▇▇▇▇▇▇▇▇▇▇▇▇▇ 231.23
2009: ▇ 16.43
2010: ▇▇▇▇ 50.21
2011: ▇▇▇▇▇▇▇▇▇▇▇▇▇▇▇▇▇▇▇▇▇▇▇▇▇▇▇▇▇▇▇▇▇▇▇▇▇▇▇▇▇▇▇▇▇▇▇▇▇▇ 508.97
2012: ▇▇▇▇▇▇▇▇▇▇▇▇▇▇▇▇▇▇▇▇ 212.05
2014: ▏ 1.00
An example using emoji as custom tick:
termgraph data/ex1.dat --custom-tick "🏃" --width 20 --title "Running Data"

# Running Data

2007: 🏃🏃🏃🏃🏃🏃🏃 183.32
2008: 🏃🏃🏃🏃🏃🏃🏃🏃🏃 231.23
2009:  16.43
2010: 🏃 50.21
2011: 🏃🏃🏃🏃🏃🏃🏃🏃🏃🏃🏃🏃🏃🏃🏃🏃🏃🏃🏃🏃 508.97
2012: 🏃🏃🏃🏃🏃🏃🏃🏃 212.05
2014:  1.00
An example using stdin and emoji:
echo "Label,3,9,1" | termgraph --custom-tick "😀" --no-label


😀😀😀 3.00
😀😀😀😀😀😀😀😀😀 9.00
😀 1.00
Most results can be copied and pasted wherever you like, since they use standard block characters. However the color charts will not show, since they use terminal escape codes for color. A couple images to show color examples:
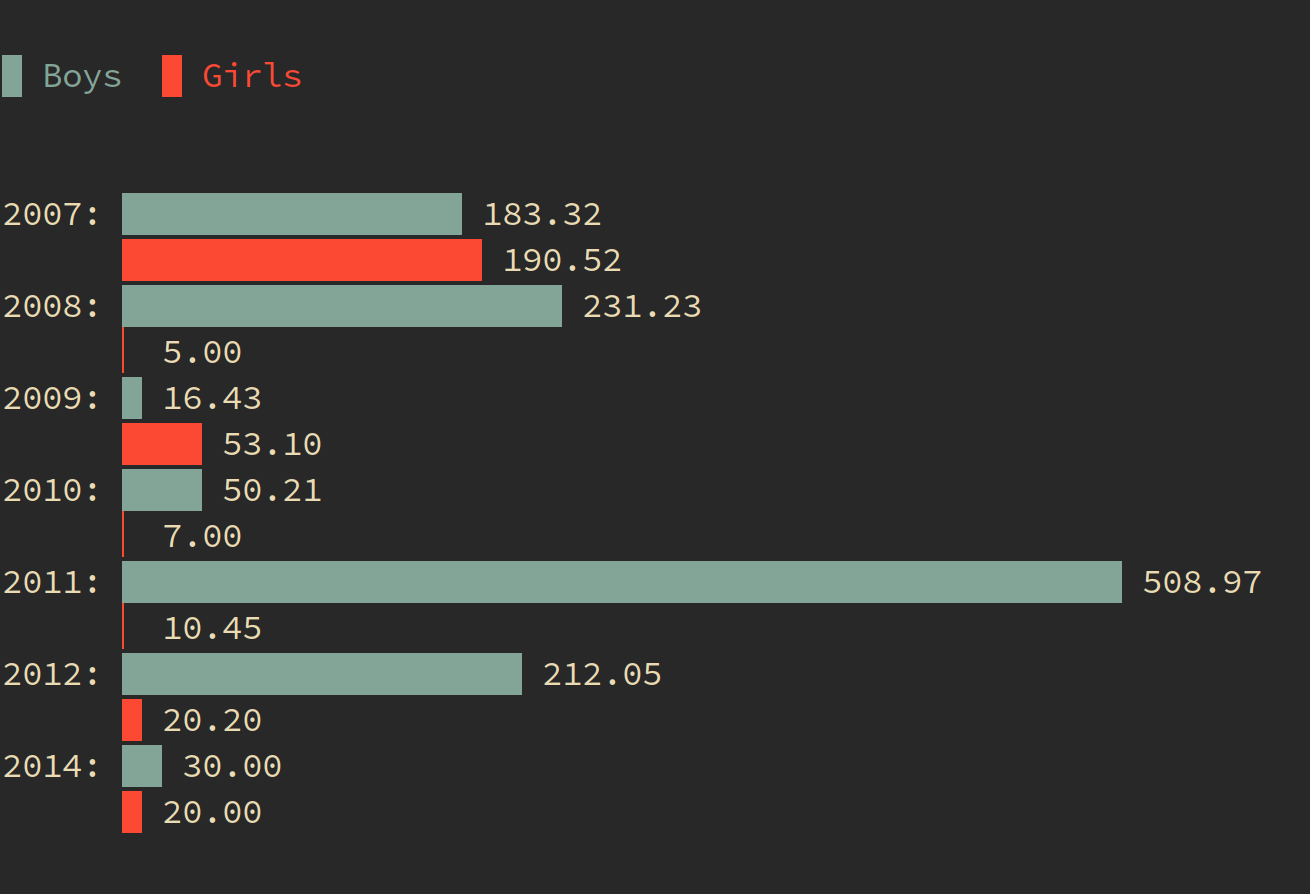
termgraph data/ex4.dat --color {blue,red}
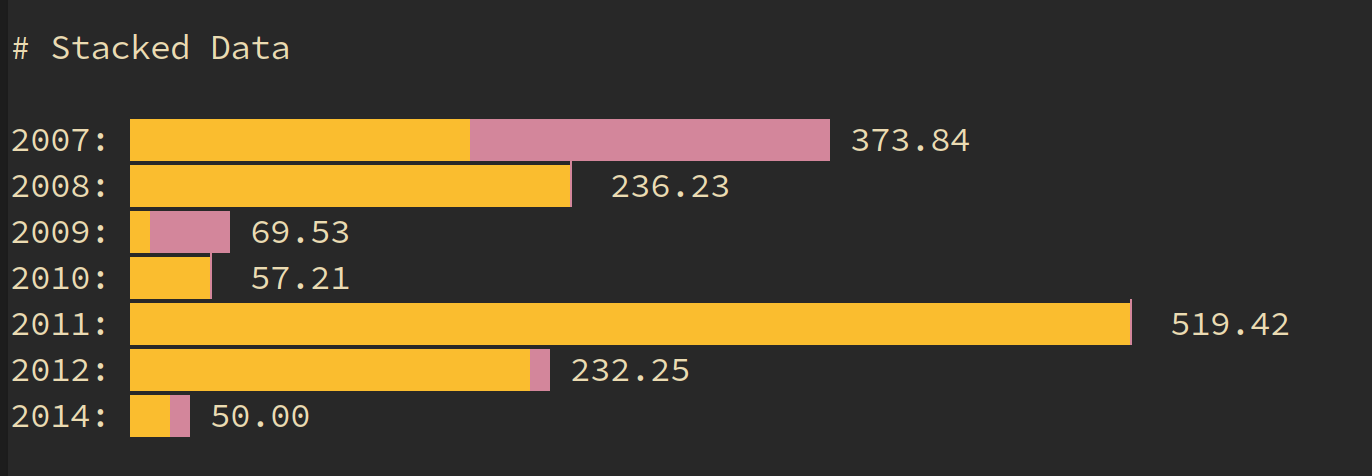
termgraph data/ex7.dat --color {yellow,magenta} --stacked --title "Stacked Data"
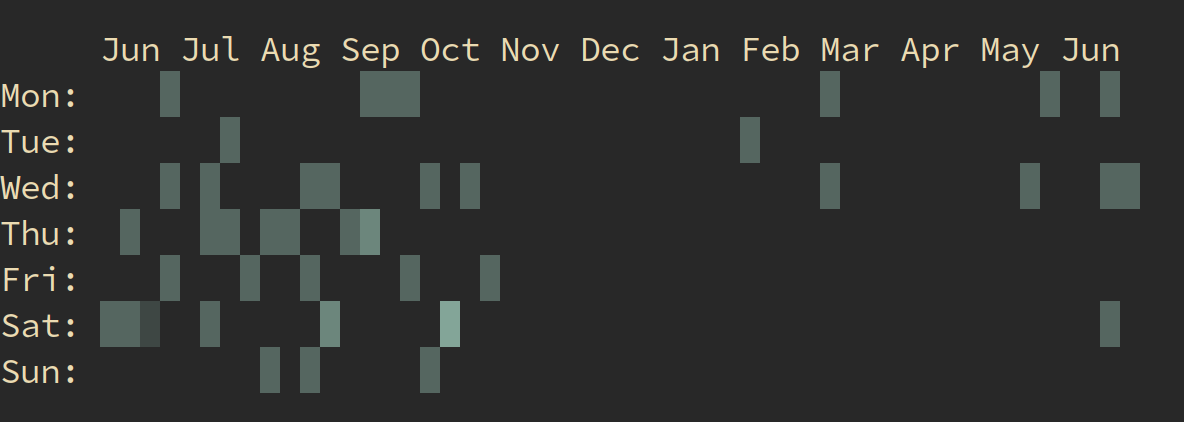
Calendar Heatmap, expects first column to be date in yyyy-mm-dd
termgraph --calendar --start-dt 2017-07-01 data/cal.dat
Install
Works best with Python3, you can install from PyPI project
pip3 install termgraph
Note: Be sure your PATH includes the pypi install directory, for me it is ~/.local/bin/
Usage
-
Create data file with two columns either comma or space separated. The first column is your labels, the second column is a numeric data
-
termgraph [datafile]
-
Help: termgraph -h
usage: termgraph.py [-h] [--title TITLE] [--width WIDTH] [--format FORMAT]
  [--suffix SUFFIX]
  [--label-before] [--no-labels] [--no-values]
  [--color [{red,blue,green,magenta,yellow,black,cyan} [{...} ...]]]
  [--vertical] [--stacked] [--different-scale] [--calendar]
  [--start-dt START_DT] [--custom-tick CUSTOM_TICK] [--delim DELIM]
  [--verbose] [--version]
  [filename]

draw basic graphs on terminal

positional arguments:
  filename              data file name (comma or space separated). Defaults to stdin.

optional arguments:
  -h, --help            show this help message and exit
  --title TITLE         Title of graph
  --width WIDTH         width of graph in characters default:50
  --format FORMAT       format specifier to use.
  --suffix SUFFIX       string to add as a suffix to all data points.
  --no-labels           Do not print the label column
  --no-values           Do not print the values at end
  --color [{red,blue,green,magenta,yellow,black,cyan} [{...} ...]]
                        Graph bar color( s )
  --vertical            Vertical graph
  --stacked             Stacked bar graph
  --different-scale     Categories have different scales.
  --calendar            Calendar Heatmap chart
  --start-dt START_DT   Start date for Calendar chart
  --custom-tick CUSTOM_TICK
                        Custom tick mark, emoji approved
  --delim DELIM         Custom delimiter, default , or space
  --verbose             Verbose output, helpful for debugging
  --label-before        Display the values before the bars
  --version             Display version and exit
Background
I wanted a quick way to visualize data stored in a simple text file. I initially created some scripts in R that generated graphs but this was a two step process of creating the graph and then opening the generated graph.
After seeing command-line sparklines I figured I could do the same thing using block characters for bar charts.
Contribute
For feature requests or bug reports, use Github Issues.
Thanks to all the additional Contributors.
License
MIT License, see LICENSE.txt
Release history Release notifications | RSS feed


Download files
Download the file for your platform. If you're not sure which to choose, learn more about installing packages.
Source Distribution
Built Distribution
Filter files by name, interpreter, ABI, and platform.
If you're not sure about the file name format, learn more about wheel file names.
Copy a direct link to the current filters
File details
Details for the file termgraph-0.3.0.tar.gz.
File metadata
- Download URL: termgraph-0.3.0.tar.gz
- Upload date:
- Size: 11.7 kB
- Tags: Source
- Uploaded using Trusted Publishing? No
- Uploaded via: twine/3.1.1 pkginfo/1.5.0.1 requests/2.22.0 setuptools/45.2.0 requests-toolbelt/0.9.1 tqdm/4.46.1 CPython/3.8.2
File hashes
| Algorithm | Hash digest | |
|---|---|---|
| SHA256 |
dc1c9eeb2e2f78bb7de07f8e1de442b07b69645bff8d0000ee38f5643bf35bf5
|
|
| MD5 |
5d84db6638c91e3994fdf5fe47857ce4
|
|
| BLAKE2b-256 |
8bff09e2bd434ad5899382955738c1b0259763c47dc0233975a5767d3d63bf13
|
File details
Details for the file termgraph-0.3.0-py3-none-any.whl.
File metadata
- Download URL: termgraph-0.3.0-py3-none-any.whl
- Upload date:
- Size: 9.9 kB
- Tags: Python 3
- Uploaded using Trusted Publishing? No
- Uploaded via: twine/3.1.1 pkginfo/1.5.0.1 requests/2.22.0 setuptools/45.2.0 requests-toolbelt/0.9.1 tqdm/4.46.1 CPython/3.8.2
File hashes
| Algorithm | Hash digest | |
|---|---|---|
| SHA256 |
6fedf4fbc04d6a90211a4a7ef32b9c648323dea85d95e0ad678af46e765c6aea
|
|
| MD5 |
c23653a2c5fad817418c1d65549b3677
|
|
| BLAKE2b-256 |
32a5e0d5875c263875700bcd5373a9d80ea5321c1c462a8d3c8a0820cfdc0f3d
|


