Titania monitoring framework
Project description
Titania
This is framework made for VELO LHCb data visualization. It's made to be fully customizable.
Requirements
Python 3.7
First u should make sure that u have PyQt5 and matplotlib installed:
pip install -r requirements.txt
To download project:
git clone https://gitlab.cern.ch/mmajewsk/lovell_plus_plus.git
To run:
Just go into src and:
python main.py
To run tests from CI sometimes it is needed to add:
set PYTHONPATH=%PYTHONPATH%;src;tests
Run project
Then from GUI folder u can run this script:
python main.py
What is this project
@TODO
Quick Guide:
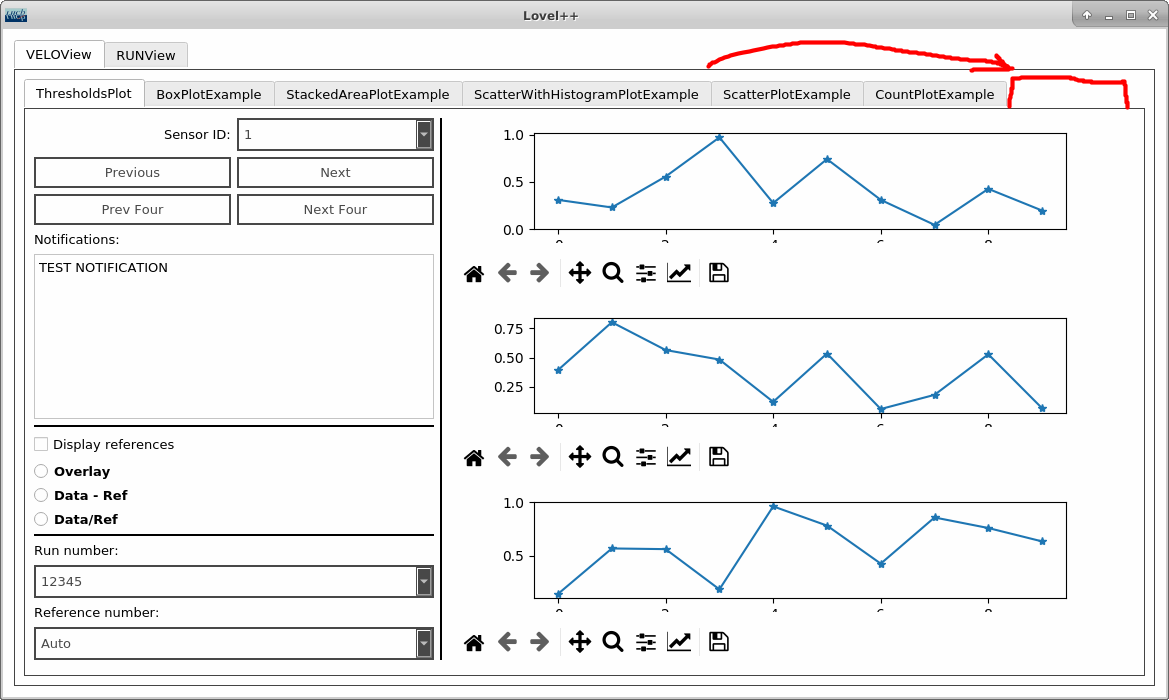
Ok, so lets say that you want add new tab to the Lovell:
Right here:
First: Defining data
Thats very easy step. We store data related code at src/Data. You can find some implementations there.
If the thing that you are looking for is not there, you should add your own class there.
that is extending Data.data_core.data_interface. It is very simple.
The only requirements are that your class have fetch() method, that returns the actual data.
Lets implement it with an example:
import random
from Data.data_core import LovellDataInterface


class RandomNList(LovellDataInterface):
    def __init__(self, n=10):
        self.n = n

    def fetch(self):
        return [random.random() for i in range(self.n)]
And that's it!
(The RandomNList class can be found in package Data.exemplary_generated_data)
Creating the Plot
We need something that we want to look at, we can easilly implement some kind of plot by extending MplPlot.
This class uses Matplotlib for plotting.
(If you would like to use any other plotting framework, you must at least extend PlotInterface class.)
from GUIWidgets.PlotWindow.Plot.base_plot import MplPlot

class OurPlot(MplPlot):

    def draw_plot(self):
        ax = self.figure.add_subplot()
        ax.plot(self.widget.data.fetch())
        self.draw()
Very simple, we inherit from that class, and we only need to define draw_plot.
We already have self.figure as matplotlib object, as a property of MplPlot class.
We can save this as a python file in PlotWindow/Plot.
##Part three, the prestige: Implementation of tab
Creating new python file
We will create exemplary plot.
We will create file called exemplary_gui.py, and put it in View -> VELOView -> Exemplary -> exemplary_gui.py
Notice, that the Exemplary folder does not exist, yet.
This is because we are structuring the files used to create tabs, in simmilar way that we structure tabs themselves.
You can look around in View folder to see that this is true.
Altough this is not necessesary, this is the convention that we chose.
Writing code
Now, we will create minimal implementation for new tab, line by line.
Tab class
from GUIWidgets.base_tab import SimpleTab

class Exemplary(SimpleTab):
    pass
First we create tab class, in this case called Exemplary.
All of the tab implementations need to implement at least class GUIWidgets.base_tab.TabInterface.
This interface requires the following components:
- data argument in constructor, as in
__init__(self, data). This object must inherit from LovellDataInterface. - plot_panel_grid - assigned in constructor
- lineLayout - assigned in constructor
- grid_layout- assigned in constructor
- Method create_control_panel - that creates panel for the tab
- Method set_title - that returns the string with the name of the tab.
- Method initiate - that is runned after the creation of tab object, when we want to draw it on gui. But our class is using sub-class that is already implementing
The TabInterface class is inherited by SimpleTab, BaseLayoutTab, PlotTab.
In most of the cases you should use them instead of inheriting directly from TabInterface.
The recommended way is by subclassing BaseLayoutTab.
The minimal requirements for inheriting from BaseLayoutTab are as follows:
- call
BaseLayoutTabconstructor withdataargument - implement method set_title
- implement method create_control_panel
- implement method set_plot
Lets go back to our example
Data
from GUIWidgets.base_tab import BaseLayoutTab
from Data.data_core import EmptyLovellData

class Exemplary(BaseLayoutTab):
    def __init__(self, parent=None):
        BaseLayoutTab.__init__(self, data=EmptyLovellData(), parent=parent)
We added EmptyLovellData to the call of the constructor.
The data object must inherit from LovellDataInterface.
This interface only requirec implementation of fetch() method, that will return data.
Name
Next we add the name of the tab, by implementing method set_title.
    def set_title(self):
        return "example"
control panel
We add control panel, that we will use to navigate through the data.
    def create_control_panel(self):
        return EmptyControlPanel()
For now we leave that empty, with EmptyControlPanel.
Plotting
Now we must define set_plot. It must return object that Inherits PlotInterface. But we can also use partially implemented SimplePlot that inherits from that interface.
    def set_plot(self):
        return OurPlot(widget=self)
It all comes together
Finally your file should look something like this:
from GUIWidgets.base_tab import BaseLayoutTab
from GUIWidgets.ControlPanel.main_control_panel import EmptyControlPanel
from Data.exemplary_generated_data import RandomNList
from GUIWidgets.PlotWindow.Plot.our_plot import OurPlot

class Exemplary(BaseLayoutTab):
    def __init__(self, parent=None):
        BaseLayoutTab.__init__(self, data=RandomNList(), parent=parent)

    def set_title(self):
        return "example"

    def create_control_panel(self):
        return EmptyControlPanel()

    def set_plot(self):
        return OurPlot(widget=self)
Save it in the file described in previous section.
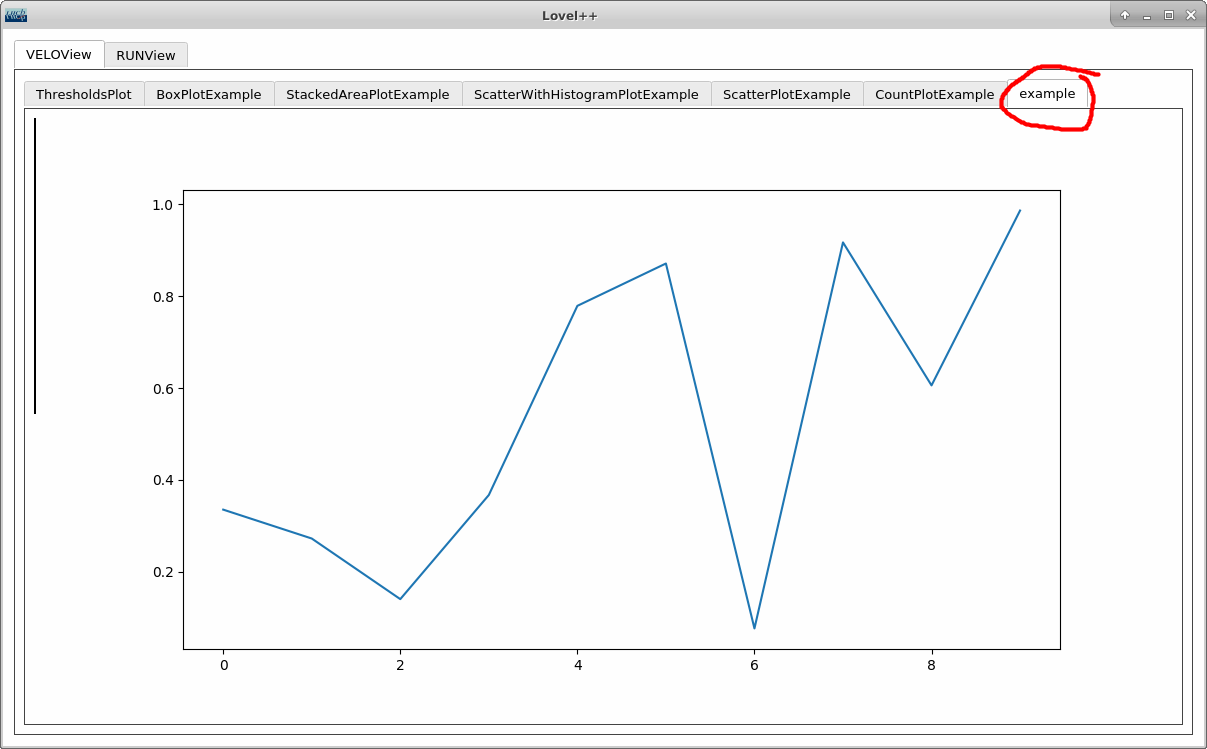
Now run lovell. Can you see the new Tab? Probably not, because we are missing one key factor. We need to add this class to the configuration.
Configuration file
Open up file Config -> config.py.
You can probably see something like this
from View.VELOView.AreaPlotTestTab.stacked_area_plot_gui import StackedAreaTestTab
# ...
# (Long list of imports)
# ...

config = {
    "VELOView": [ThresholdsPlot, BoxPlotTestTab, StackedAreaTestTab, ScatterWithHistogramPlotTestTab, ScatterPlotTestTab, CountPlotTestTab],
    "RUNView": [PedestalsPlot, AnotherThresholdsPlot, PedestalsSingleMatrixPlot]
}
This is the actual place which decides about the tabs placement. So add line that imports the created class, and add it to the list, like this:
from View.VELOView.AreaPlotTestTab.stacked_area_plot_gui import StackedAreaTestTab
# ...
# (Long list of imports)
# ...

from View.VELOView.ExemplaryPlotTab.exemplary_gui import Exemplary

config = {
    "VELOView": [ThresholdsPlot, BoxPlotTestTab, StackedAreaTestTab, ScatterWithHistogramPlotTestTab, ScatterPlotTestTab, CountPlotTestTab, Exemplary],
    "RUNView": [PedestalsPlot, AnotherThresholdsPlot, PedestalsSingleMatrixPlot]
}
Now when you run lovell you should be able to see your tab.
Of course, everything is empty. But now, with all of the knowledge that you gained, it should be easy for you to implement anything that you want to view here.
New plot type
If you would like to create new plot, the easiest way is to inherit from SimplePlot class, and reimplement draw_plot method.
Remember to use self.widget.data.fetch() to get data!
Then you can return your new plot object in set_plot method in your tab.
Take a look at GUIWidget -> PlotWindow -> Plot to get inspiration.
Project details
Download files
Download the file for your platform. If you're not sure which to choose, learn more about installing packages.


