Python library to analyze and visualize data from Microsoft Viva Insights.
Project description
vivainsights 
Overview
This is an Python package for analyzing and visualizing data from Microsoft Viva Advanced Insights (previously Microsoft Workplace Analytics). Access to the Analyst Experience is required. With this library, you can generate visualizations and compute analyses in a way that adheres to the analysis best practices of the Viva Insights query outputs. This library mirrors the design of its R library counterpart.
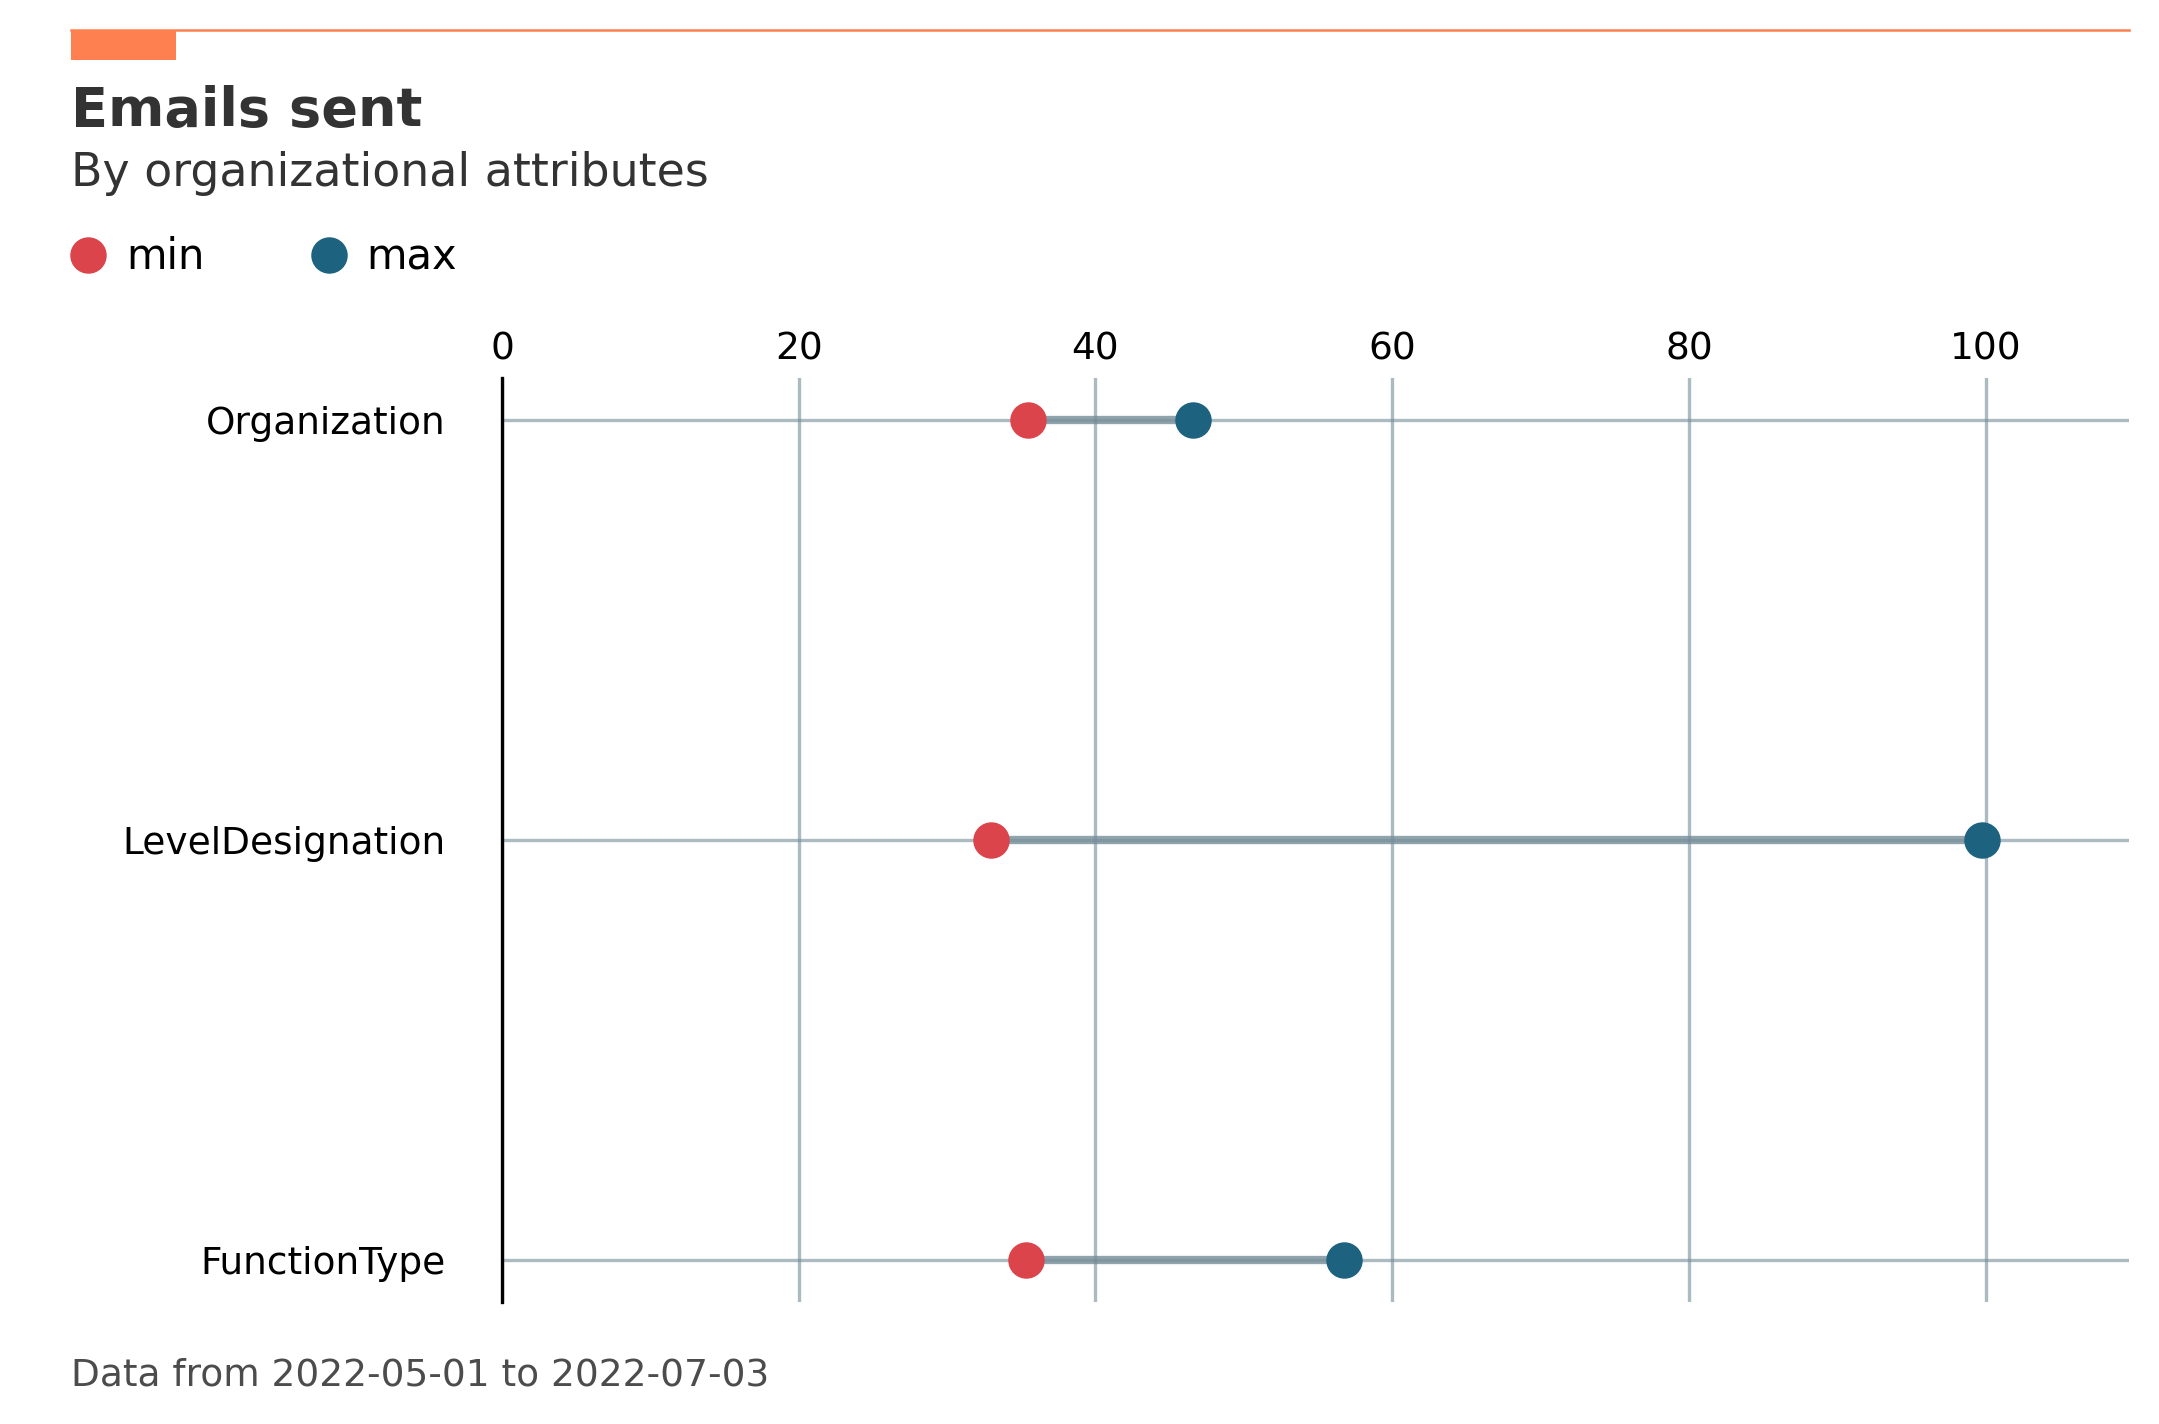
Example output when running create_rank():

Installation
- Clone this repository to your local drive.
- On PowerShell, change directory (
cd) to the repository on your local drive, and runpython setup.py install. This should install 'vivainsights' to your python package registry. To check whether it is installed, you can runpip freezeon your command prompt.
To install from this GitHub repository directly using pip, you may run this in Command Line:
pip install -e git+https://github.com/microsoft/vivainsights-py#egg=vivainsights
You can also install from a specific branch with the following, replacing the branch name with <remote-branch-name>:
pip install -e git+https://github.com/microsoft/vivainsights-py@<remote-branch-name>#egg=vivainsights
How to use
Once confirmed that the library is installed, here are some examples of what you can run from the package:
import vivainsights as vi

pq_data = vi.load_pq_data() # load and assign in-built person query
mt_data = vi.load_mt_data() # load and assign in-built meeting query

# visualize averaged metrics per group (using person-averaging)
out_plot = vi.create_bar(data=pq_data, metric='Emails_sent', hrvar='Organization', mingroup=5)
out_tab = vi.create_bar(data=pq_data, metric='Emails_sent', hrvar='Organization', mingroup=5, return_type='table')

out_plot.show() # display plot interactively, using plt
print(out_tab) # print summary table to console
Most functions come with an option to generate a matplotlib figure object or a summary table in the form of a Pandas DataFrame, which can be specified with the argument return_type. Once these output objects are generated, they can also be copied to clipboard or saved locally using the vi.export() function:
# export summary table results to clipboard
vi.export(out_tab)

# save plot locally as png
vi.export(out_plot, file_format = 'png')
The following demonstrates several other examples of visualization outputs:
# Calculate counts of distinct people in each sub-population
vi.hrvar_count(data=pq_data, hrvar='Organization', return_type='plot').show()
vi.hrvar_count(data=pq_data, hrvar='Organization', return_type='table')

# Get date ranges from data frame, using 'MetricDate'
vi.extract_date_range(data=pq_data)
vi.extract_date_range(data=pq_data, return_type = "text")

# create a line chart showing average of metrics by sub-pop group over time
vi.create_line(data=pq_data, metric='Emails_sent', hrvar='Organization', mingroup=5, return_type='plot').show()
vi.create_line(data=pq_data, metric='Emails_sent', hrvar='Organization', mingroup=5, return_type='table')

# create a heatmap chart showing average of metrics by sub-pop group over time
vi.create_trend(data=pq_data, metric='Emails_sent', hrvar='Organization', mingroup=5, return_type='plot').show()
vi.create_trend(data=pq_data, metric='Emails_sent', hrvar='Organization', mingroup=5, return_type='table')

# Calculate the mean value of a metric for all groups in the dataset
vi.create_rank(
    data=pq_data,
    metric='Emails_sent',
    hrvar=['Organization', 'FunctionType', 'LevelDesignation'],
    mingroup=5,
    return_type='table'
    )

# Visualize the top and bottom values across organizational attributes
vi.create_rank(
    data=pq_data,
    metric='Emails_sent',
    hrvar=['Organization', 'FunctionType', 'LevelDesignation'],
    mingroup=5,
    return_type='plot'
    ).show()
To perform analysis on a dataset from a flexible query (stored as a .csv file), there is a simple three step process:
# 1. Load package
import vivainsights as vi

# 2. Load csv
pq_df = vi.import_query(x = '/data/VI_PERSON_QUERY.Csv')

# 3. Create analysis
vi.create_rank(
    data = pq_df,
    metric = 'Collaboration_hours',
    hrvar = ['Organization', 'LevelDesignation', 'FunctionType']
)
Related repositories
- Viva Insights R library
- Viva RMarkdown Report Marketplace
- Viva Insights Sample Code
- Viva Insights Zoom Integration
- Viva Insights OData Query Download
- Viva Insights R library (legacy)
Contributing
This project welcomes contributions and suggestions. For feature and complex bug fix contributions, it is recommended that you first discuss the proposed change with vivainsight’s maintainers before submitting the pull request. Most contributions require you to agree to a Contributor License Agreement (CLA) declaring that you have the right to, and actually do, grant us the rights to use your contribution. For details, visit https://cla.microsoft.com.
When you submit a pull request, a CLA-bot will automatically determine whether you need to provide a CLA and decorate the PR appropriately (e.g., label, comment). Simply follow the instructions provided by the bot. You will only need to do this once across all repos using our CLA.
This project has adopted the Microsoft Open Source Code of Conduct. For more information see the Code of Conduct FAQ or contact opencode@microsoft.com with any additional questions or comments.
License
This library is licensed under the MIT License. For more information, please see the LICENSE file.
Project details
Download files
Download the file for your platform. If you're not sure which to choose, learn more about installing packages.
Source Distribution
Built Distribution
Hashes for vivainsights-0.1.0-py3-none-any.whl
| Algorithm | Hash digest | |
|---|---|---|
| SHA256 | e6e35b0d443f64a6b62b62acaaa0361d12eff81e808f720317b7cc7aaf1cb8c3 |
|
| MD5 | f0750f4068185820e27efa4cf519dca5 |
|
| BLAKE2b-256 | 6a5d8ea76e7d46b2e45dd31df0ea84230a82048aaf241038a2e65c3ea3cb5e68 |


